Coming up to the end of the financial year it’s a great time to analyse the past 12 months’ performance, to look for new growth opportunities, and identify any problem areas.
When conducting an annual performance review we like to look at overall performance across five key metrics (per channel).
| Sessions | Conversion Rate | Transactions | Average Transaction Value | Revenue |
Why these metrics?
The recipe for generating revenue online is simple:
Sessions x Conversion Rate x Average Transaction Value = Revenue
Increase any one metric by 10% and you make 10% more revenue.
First, we recommend conducting a Channel Analysis.
A channel analysis is a simple table that enables us to measure performance year-on-year over each channel. The key here is to compare the percentage of users driven to a channel versus the percentage of revenue generated.
It should be relatively similar, any vast differences may indicate a problem.
For example, High Sessions but Low Revenue would indicate Low-Quality Traffic, a Conversion Problem, or a potential Tracking Issue.
Channel Performance Average Month (Past 12)
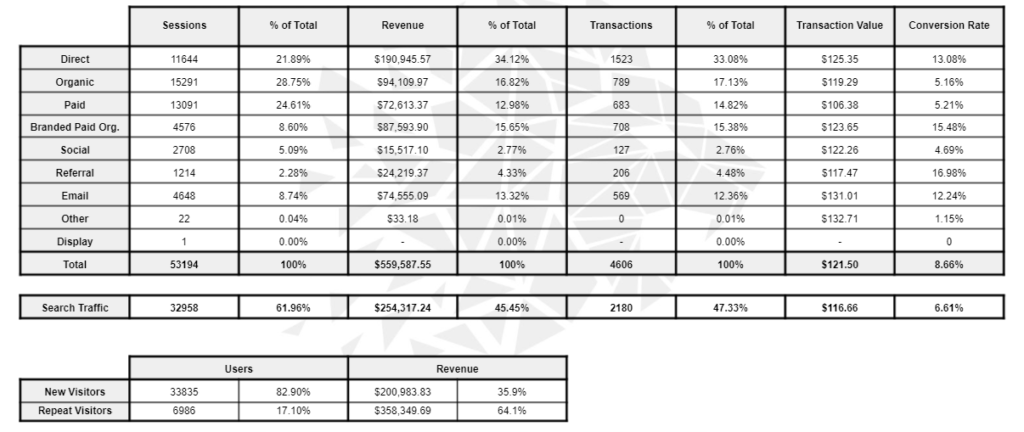
Note, in the example above we also measure the “Search” Channel (the combined Organic & Paid Channels). Why?
Because customers don’t conduct an Organic or a Paid Search, they just Search.
Measuring performance over the previous 12 months allows us to calculate what an average month looks like, taking into account seasonality (which due to CoVid has been challenging to predict).
Once calculated, we have two options:
1.Conducting a Month on Month Analysis
This allows us to measure how each calendar month performed against an average month. This can be useful for businesses with vast seasonal differences, or that have experienced a significant decline or increase in traffic or revenue.
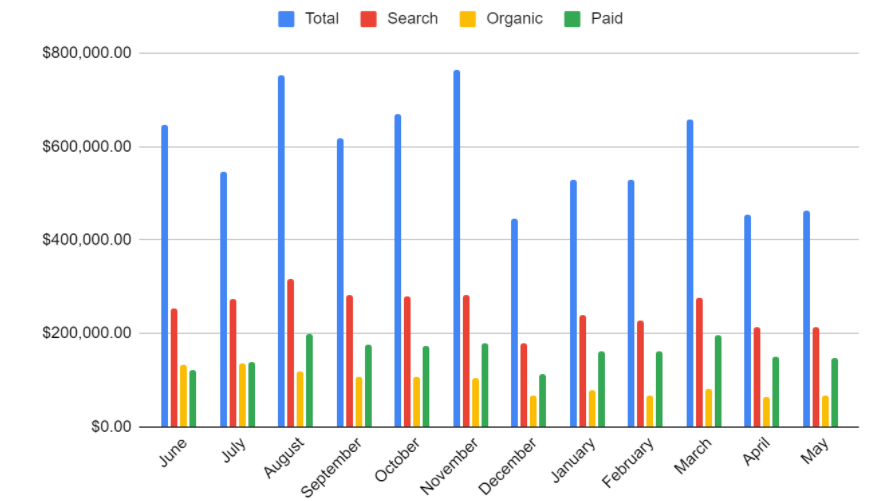
By extracting data by channel and month on month it can be presented visually over time in a variety of ways making it easier to analyse, absorb or identify complex information and data sets.
2.Identify other important eCommerce metrics & benchmarketing versus competitors.
Other Important eCommerce Metrics we analyse are:
New Vs Repeat Visitors / Revenue
An indication of how qualified traffic to the website is.
For example: Attracting 10% more New Visitors should see Repeat Visitors grow by 10%, any less may indicate unqualified traffic or a problem with visitor retention.
Repeat Purchase Rate
Also an indication of how qualified traffic is, but in addition also provides insight into customer loyalty and/or performance of “post-sale” marketing activities, useful in understanding Customer Lifetime Value.
Days / Sessions to Purchase
Very simply, a measure of either how many sessions or days it takes from the first visit to purchase. This is useful for identifying potential re-engagement opportunities across Email, Social, or Display Remarketing.
Path to Purchase
Customers don’t purchase in a single visit, they often visit multiple times across a variety of channels. This is useful for identifying opportunities to re-engage or allocating budgets more efficiently. Particularly to channels that may be part of the conversion process but are not directly attributed revenue via a standard attribution model (e.g. a first or last click).
Channel Efficiency
Total Revenue generated online divided by Spend per Channel. This measure allows for channels to be analysed on a like-for-like basis, with channels that are more efficient having a greater score. For example, Email will have a lower spend, thus be more efficient at generating than channels like Paid Search for instance. This is extremely useful in allocating budgets and identifying channel performance on a like-for-like basis.
Overall analysing Annual Performance is critically important to eCommerce success, it allows an executive to identify opportunities, problems, accurately allocate resources, and plan for success. We create analytics experience on a different level, here at LION Digital called LION View. Once a client, you can have your personal DASHBOARD, that will collect all the data for you and make your EOFY easier. This completely customisable, all-in-one and simple-to-use platform will give you an overview of eCommerce channels and metrics, Keywords rankings, Google Search Console data, our 90 day activity plan and your marketing calendar all in one convenient location. Click here to find out more.


