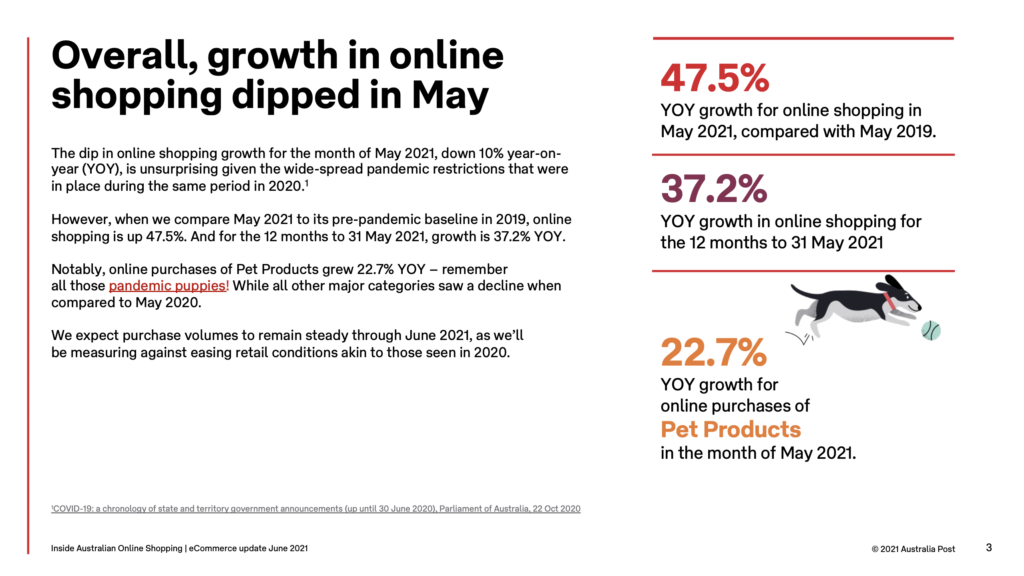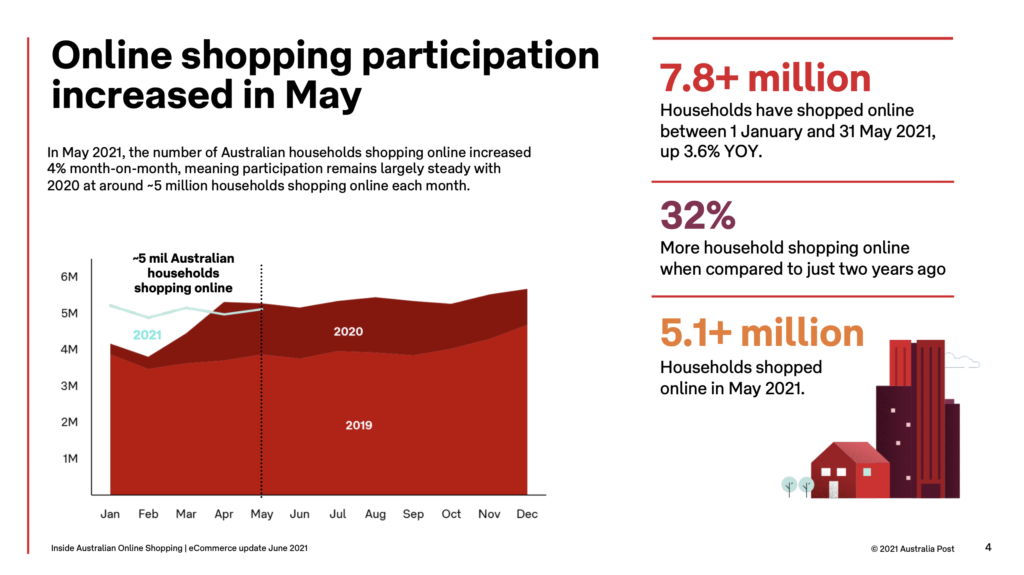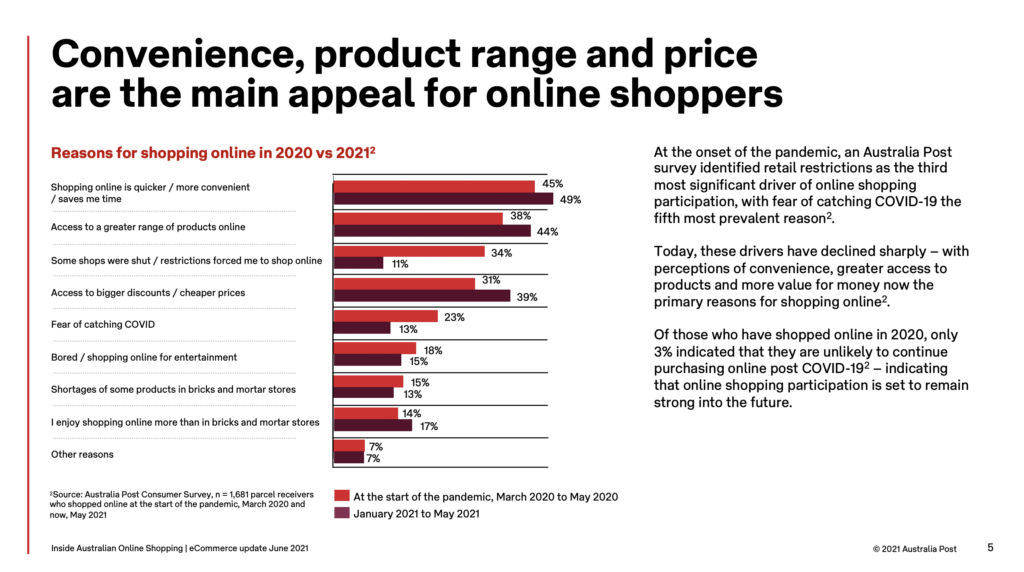
Do you know your competitors? What strategies are they using for success? The importance of being proactive rather than reactive is essential to your business success. The primary purpose is to understand the strengths and weaknesses of your business in comparison to your competitors. You will recognise how you can enhance your business strategy.
In this article, we collected the best tools to analyse the activities of your competitors as well as your business improvements.
1.Google Mobile Speed Test
https://www.thinkwithgoogle.com/intl/en-aunz/feature/testmysite/
What is it?
The Google Mobile Speed Testing tool allows you to measure the speed of your entire mobile site. The Site speed results are based on real-world data collected via the Chrome User Experience Report(CrUX). The CrUX report is updated monthly and is the source of both current and historical data.
It provides a rating for your site and identifies the monthly trend, whether improving or getting slower. What’s more, it offers a series of recommendations and allows you to compare your mobile site vs your competitors and even calculate the potential revenue generated if you were to improve the speed of your site.
What is it used for?
Website load speed is critically important to success, generally speaking, the faster the website, the better the user experience and conversion. This tool is valuable because it provides a list of recommendations for improving speed and can indicate the revenue impact of improving site speed based on real users data.
2.Builtwith
What is it?
BuiltWith is a great tool that allows anyone to analyse the technology that a website is built on; it provides detailed information via the website and has a handy Chrome extension.
What is it used for?
Built with allows you to quickly analyse a competing website’s technology platform and identify essential tech like –
Content Management System
eCommerce Platform
Email Service
3.Semrush
What is it?
SEMrush is a digital marketing tool that is predominantly focused on SEO.
It includes a massive range of helpful information for analysing Organic Performance like Keyword Rankings, Keyword Research, Traffic Analytics and even Paid Advertising.
What is it best used for?
Semrush is best used to view the keyword ranking data – with a publicly available account; it is possible to see keyword rankings over time. The graph below shows the rankings for the top 20 keywords over the past two years.
Note, if keyword rankings haven’t grown and a business is working with an SEO agency or consultant, this would indicate a problem.
4. Similarweb
What is it?
Another Digital Marketing tool that can be used to identify traffic volume per channel and compare versus competitors. To provide indicative data, this tool uses a combination of algorithmic data and cookies.
What is it used for?
While only an indication, this tool is best used to compare performance versus competitors.
5.SEO Peek
https://chrome.google.com/webstore/detail/seo-peek/lkkpfhgjmocgneajknedjhodkjkkclod?hl=en
What is it?
SEO Peak analyses a website page to display the Meta Information in a simple format.
Meta Information is the code behind the page that can impact what keyword your page ranks for. It is used by Google (and other Search Engines) to understand what a page is about and how it should be categorised. It includes things like:
- Page Title
- Meta Description
- Meta Keywords
- H1 Tags
What is it used for?
While Google is getting significantly better at understanding what content is on a page, providing Google with additional instructions through metadata is critically essential.
Pictured shows a brief example of a site that has limited metadata.
6.Google Trends
https://trends.google.com/trends
What is it?
Google Trends graphs the interest in a search term or topic over a period of time, which can be filtered by region. The graph below shows the Beauty topic in Australia over the last 5 years – the graph shows the topic is gradually becoming less popular.
As per Google – Numbers represent search interest relative to the highest point on the chart for the given region and time. A value of 100 is the peak popularity for the term. A value of 50 means that the term is half as popular. A score of 0 means there was not enough data for this term.
What is it used for?
Google Trends is an excellent tool for understanding how popular a topic is over a period of time. An increase in popularity would indicate more searches occurring. This is great for understanding seasonality and year on year growth.
Need help with understanding the best tool for your business?
GET IN CONTACT TODAY AND LET OUR TEAM OF ECOMMERCE SPECIALISTS SET YOU ON THE ROAD TO ACHIEVING ELITE DIGITAL EXPERIENCES AND GROWTH

Leonidas Comino – Founder & CEO
Leo is a, Deloitte award winning and Forbes published digital business builder with over a decade of success in the industry working with market-leading brands.
Like what we do? Come work with us


